My Long Overdue Starbucks Project
Amy Tzu-Yu Chen / 2016-10-04
Like many others around the globe, I am a Starbucks product collector. This was a long overdue project that I have always wanted to do throughout my almost 7 years’ life as a collector. The idea is to create a ranking system for fellow collectors to understand the supply/demand of each beautiful mug. I was fairly satisfied with the result, although it would never be perfect since there are always new products coming out and the Starbucks collector community will only continue to expand!
Introduction
Lots of us have hobbies that outsiders could not easily understand. Poster collectors tirelessly hunt for vintage posters on eBay and at local antique shops. Sneaker collectors camp outside of Footlocker overnight just to get a pair of limited edition basketball shoes. The outsiders call these addicted collectors crazy for spending so much time and money on chasing after incomprehensible collectibles. However, collectors need not care about judgments from outsiders because they often have formed their own community, oftentimes online, where they make friends with collectors who share the same passion and insider language.
This project focuses on using web scraping, data visualization, and K-means clustering (an unsupervised method) to understand a special group of collectors: Starbucks collectors. These collectors often refer to themselves as “muggers” and are usually active on Facebook, eBay, and other online social platforms. Muggers actively exchange or purchase secondhand Starbucks products from other collectors around the world.
Web Scraping: Data Acquisition
One of the biggest online platforms for the Starbucks collector community is a user-contributed website called Fredorange. An Austrian Starbucks collector created the site as a virtual platform for muggers to share and contribute information about Starbucks products. Muggers can also use this site to set up deals. Fredorange has been the go-to website whenever old and new muggers want to find out latest Starbucks product release or to simply showcase their collection.
For this project, I am interested in creating a database for Starbucks collectibles and collector profiles in order to find patterns in supply and demand of mugs. I decided to scrape the following attributes from Fredorange.
Mug Profile: name, city, country, edition, # of owners/users, # of seekers, # of traders User/Mugger Profile: username, city, country, # and percentage of mugs owned, # of mugs seeking, #of mugs trading Using the BeautifulSoup and pandas packages in Python, I scraped the desired attributes from Fredorange.com. The following is the code for scraping user profiles.
Data Cleaning
Data cleaning was difficult because all data were contributed by users. Fredorange does not give users options of city and country when they sign up for an account. As a result, there were many phrases with typos, or in different spellings or foreign languages in city and country attributes. Also, some users chose to only indicate their city but leave their country blank so it was another tedious task to figure out users’ country from their city. The code below reflects a small part of this data cleaning process.
Shiny
I created a shiny for non-collectors to understand how Starbucks muggers communicate and for collectors to visualize current supply and demand of Starbucks secondhand products. The website consists of four parts. The first tab shows the geographic distribution of Starbucks products and the collector community. The second tab shows a ranking system of product values based on K-means clustering result. The third tab shows Scarcity vs. Popularity graph for collectible mug editions. The last tab shows Scarcity vs. Popularity graph for popular collectable countries of origin.
Visualizing Starbucks Collector Community
After data cleaning, it was possible to visualize the geographic distribution of Starbucks products and collectors. Unsurprisingly, the United States has the largest numbers of products and collectors. One can visualize the geographic distributions of collectors and products outside of United States by selecting maps that say “… excluding USA”.
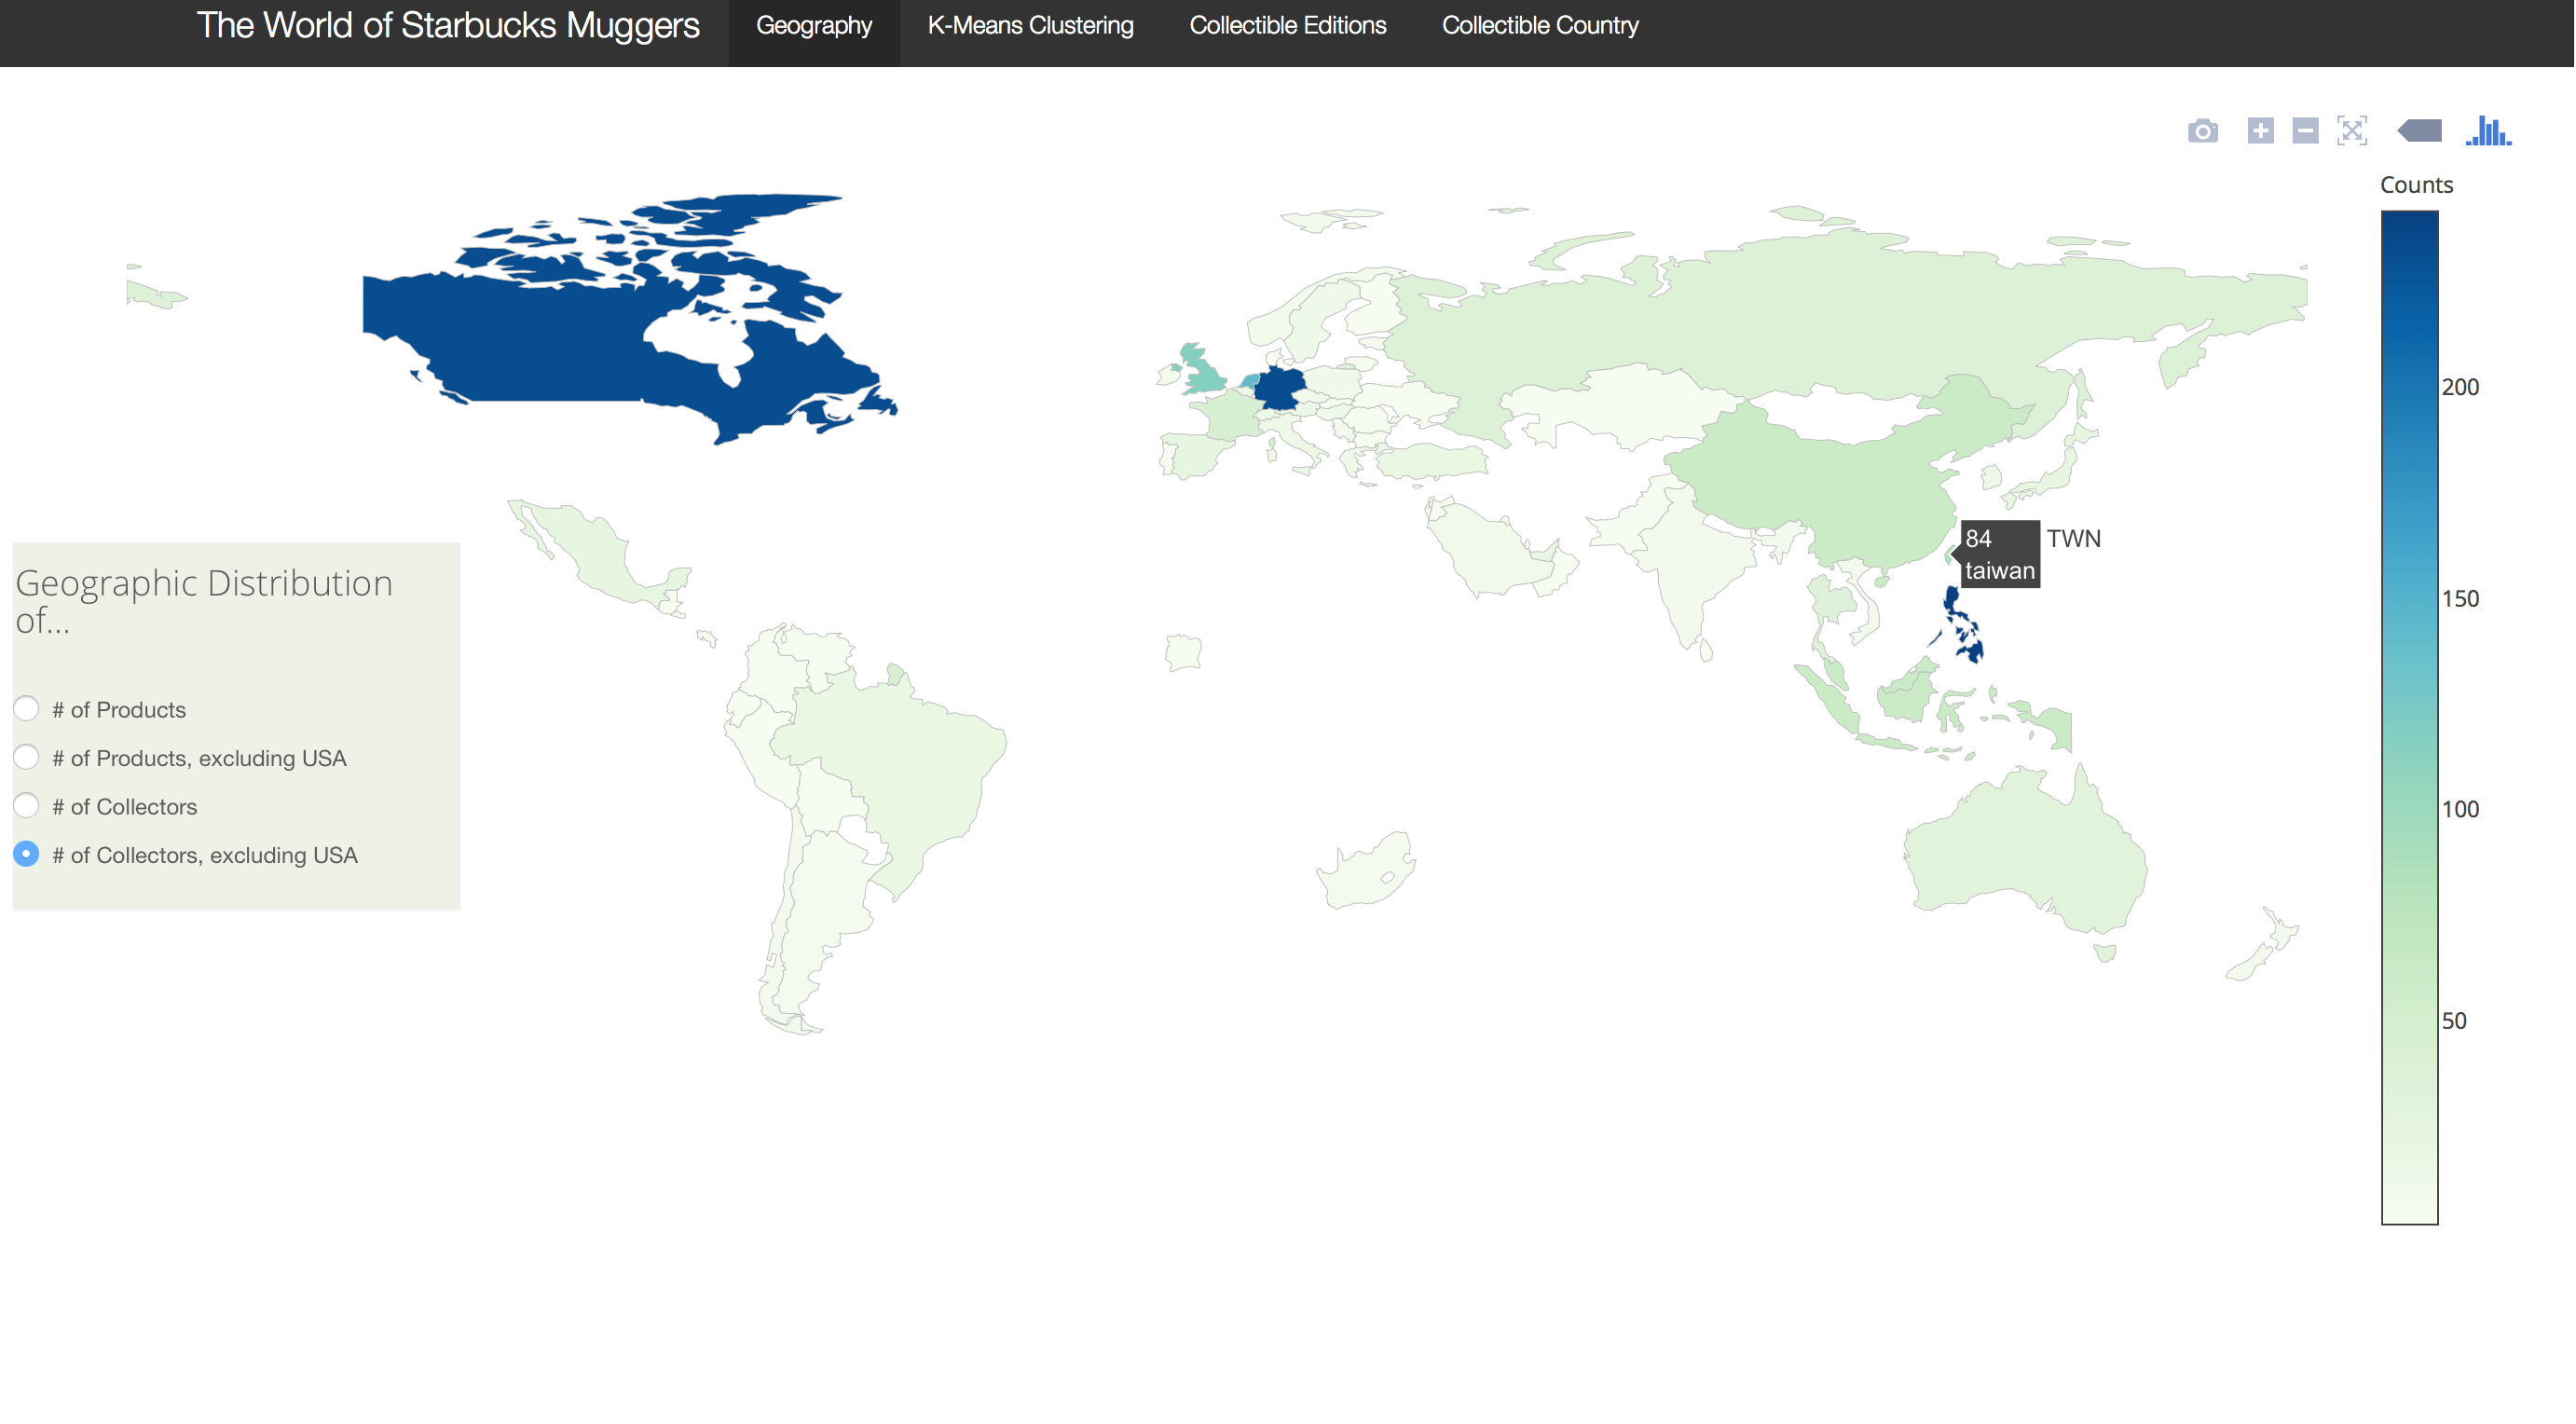
This is how the geographic distribution map of collectors outside of USA looks on the Shiny App. Other than United States, collecting Starbucks product is a popular activity in Canada, parts of western Europe, and parts of East Asia.
K-means Clustering on Mugs
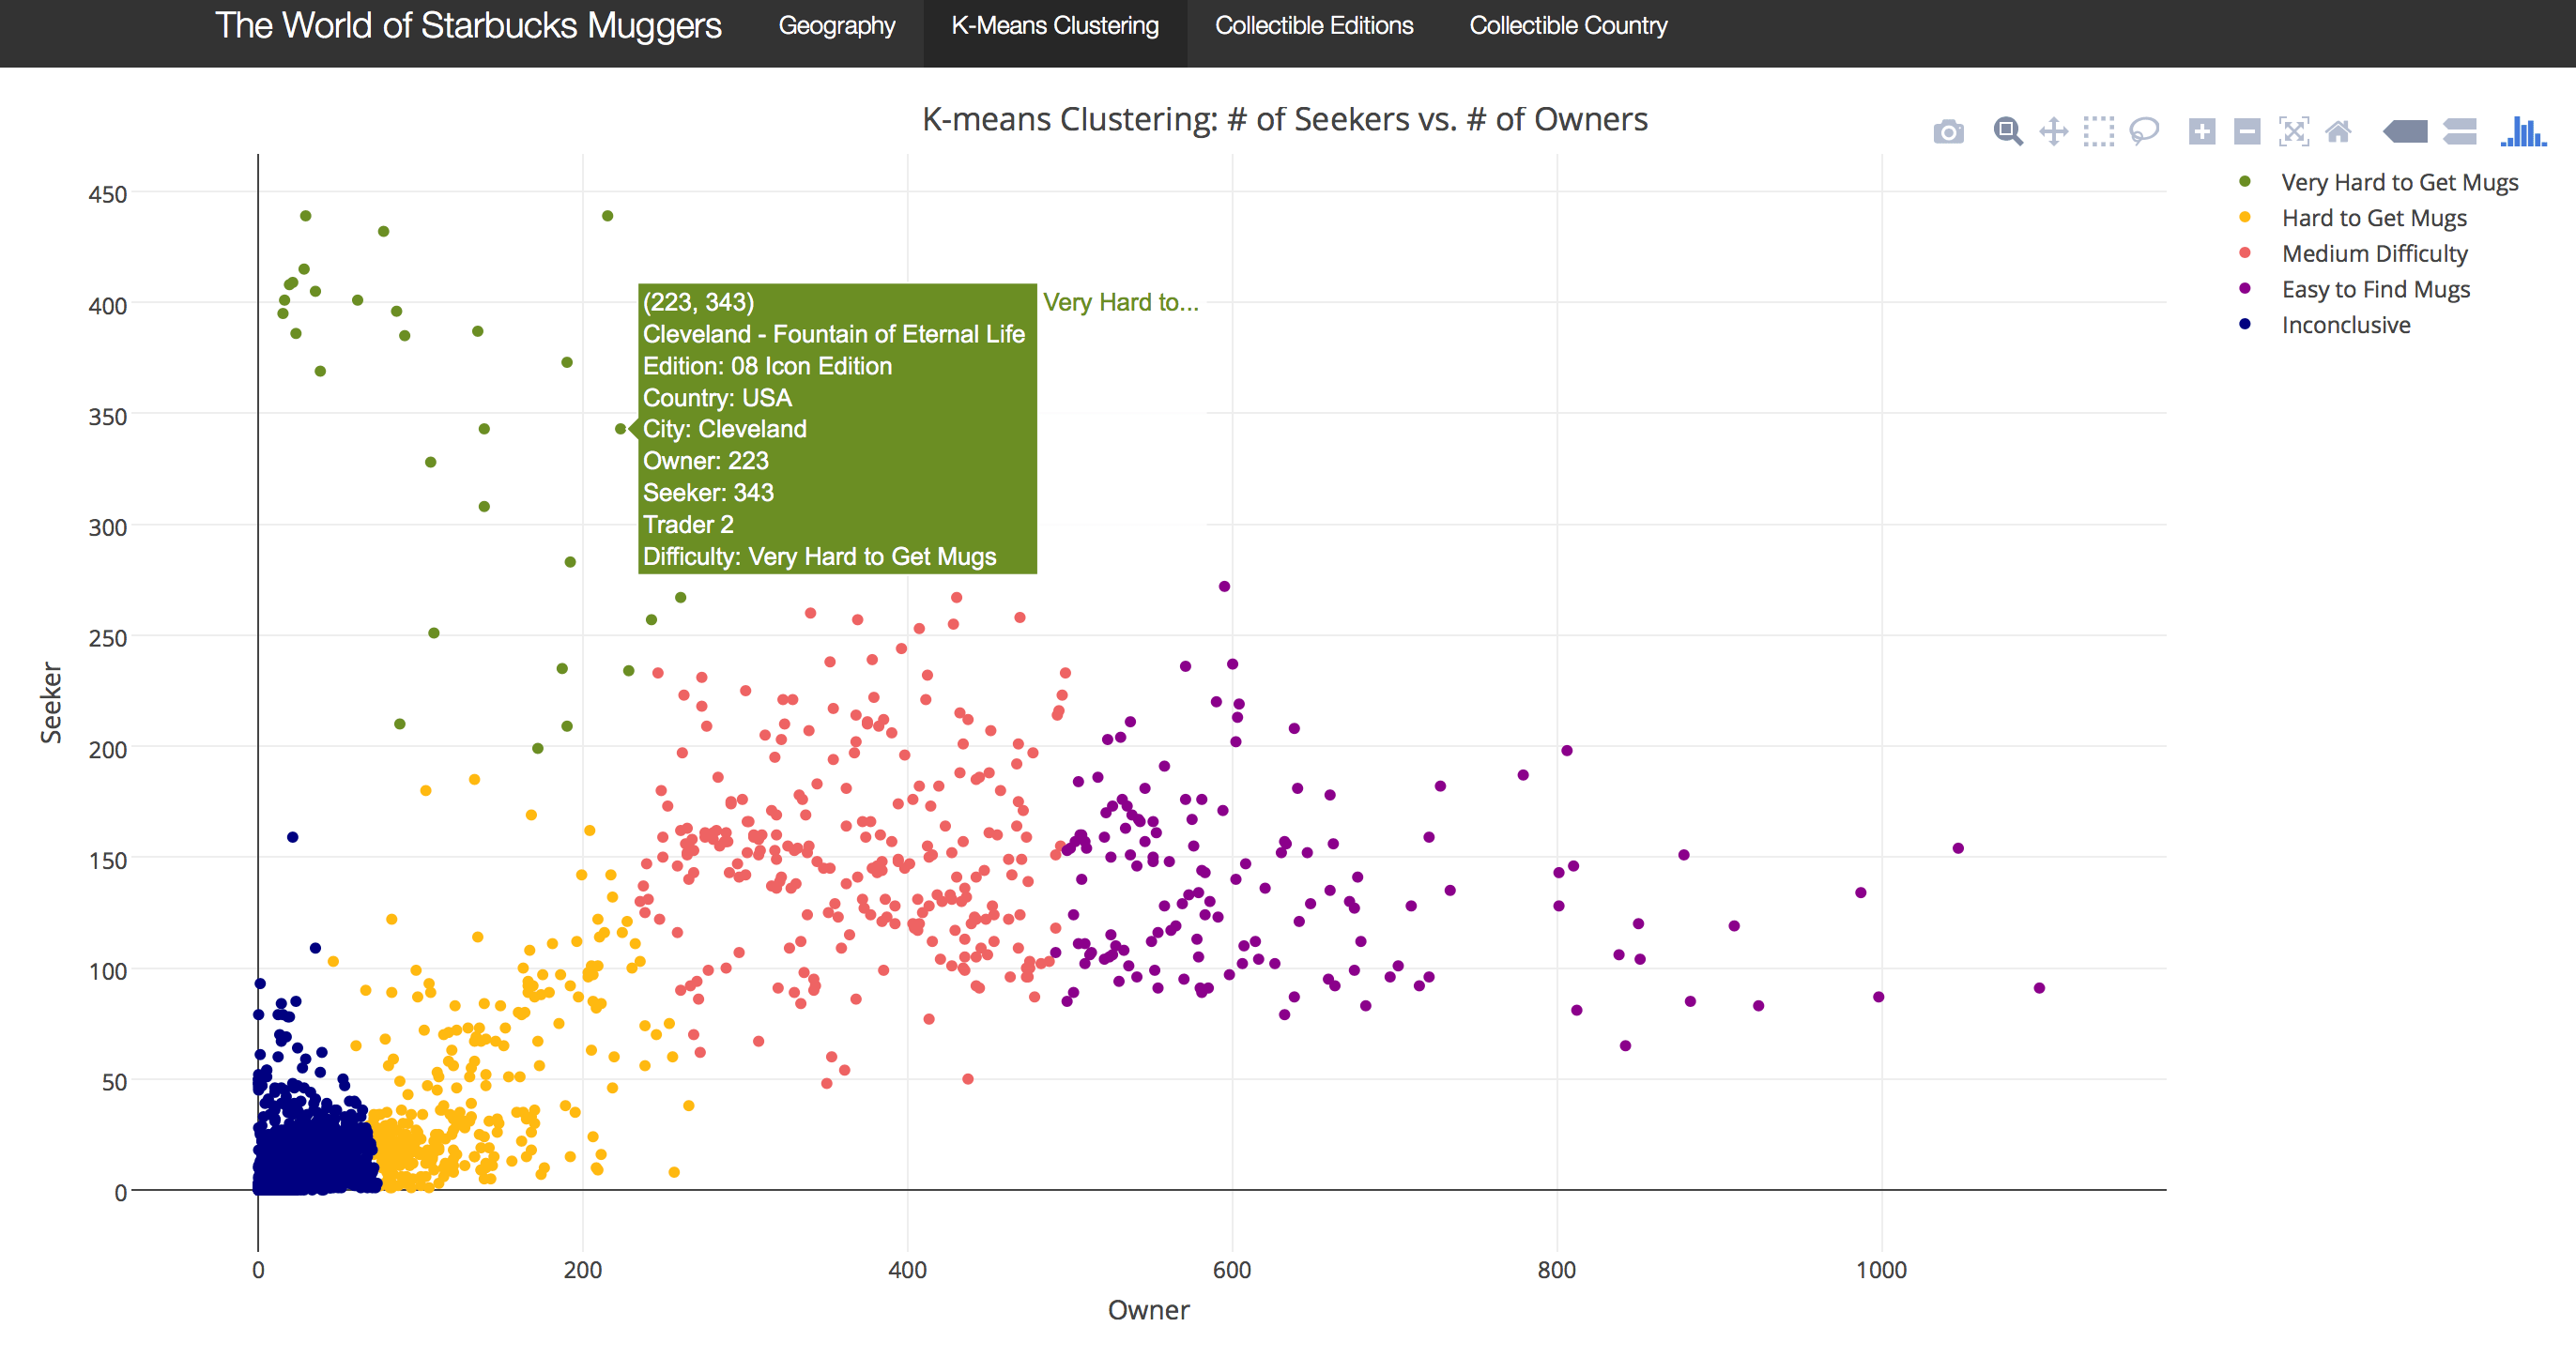
Using K-means clustering algorithm on the numbers of owners, seekers, and traders as inputs, I separated all mugs into 5 distinct groups. The choice of k was based on examination of within-cluster variances of different k’s. The parameter, nstart, was set to 100 so that the algorithm was run 100 times before selecting the lowest within-cluster variance.
The K-means clustering result clearly separates all mugs into 5 groups with distinct characteristics, which I labeled into five categories: Easy to Find (Purple), Medium Difficulty (Red), Hard to Get (Yellow), Very Hard to Get (Green), and Inconclusive (Blue). The screenshot below shows how the ranking system based on K-means clustering looks on the Shiny App. Note that K-means clustering is an unsupervised algorithm so the ranking system was not a classification model. However, the clustering result does allow us to effectively have an idea about the value of each mug in the secondhand market. The five categories are self-explanatory except Inconclusive. One cannot easily label those mugs with few traders, seekers, and owners because there are two possible explanations.They might be new products, which just have not started trading yet, or they could simply be unpopular.
Visualizing Collectible Editions & Countries of Origin
Four editions and six countries were included in the last two tabs of the Shiny app because they have relatively large numbers of “high difficulty mugs”. Users can select only editions or country of interest to visualize each mug’s supply and demand in the secondhand market. Details about each mug will show up when users hover over each data point.
This is how the Scarcity vs. Popularity graph looks on the Shiny App. Two new variables derived from seekers and owners are used to help visualize supply and demand of mugs from popular editions and counties of origin. Popularity is an index ranges from 0-1 using the formula, Seeker/max(Seeker). Scarcity is another index ranges from 0-1 using the formula, |Owner/max(Owner)-1|. For example, mugs with high popularity and high scarcity are most likely Hard to Find Mugs. Similarly, mugs with low popularity and low scarcity are most likely Easy to Find Mugs.
Python Packages used:
- BeautifulSoup
- pandas
R Packages used:
- shiny
- dplyr
- plotly
- countrycode