NYC Pre-Kindergarten Explorer
Amy Tzu-Yu Chen / 2016-10-04
Photo: Henri Cartier-Bresson
This was my second project at NYC Data Science Academy. Also, it was my first time using R Shiny to create a website for public use. It was fun and I started to develop interests in front-end development afterward. If you happen to be a parent in New York City, I hope you find this website useful for planning your kid’s early education.
Motivation
In 2013, Mayor De Blasio campaigned on a promise of universal pre-kindergarten. The program makes access to free pre-kindergarten education available to all NYC families, regardless of child’s abilities and family income. Now, three years later, NYC enrolls more children in full-day pre-K than any state except Georgia, and its preschool enrollment exceeds the total number of students in San Francisco or Boston. While the statistics show a positive outlook in early child education, the program received complaints and doubts from parents. Although every city child is promised a free seat, many children were slotted for schools miles away from their home. Also, as the number of pre-K locations increases to accommodate all four-year-old children, the quality of the education is in question.
In this project, I created a Shiny app as a comprehensive guide for parents who do not understand Universal Pre-K or simply want to find the closest and most suitable pre-K for their child. This Pre-K guide gives information about each pre-K’s location, contacts, meal plans, playspace, extended daycare options, and enrollment restrictions. Also, it allows the public to visualize whether there are enough seats for eligible kids in each borough.
Overview of Pre-K Explorer
Pre-K Explorer has five sections, each with helpful information about Universal Pre-K. Pre-K Map allows users to locate preschools in their neighborhood. Pre-K Catalog shows detailed contact and facility information of all pre-K’s in NYC. Pre-K Statistics helps one visualize whether the supply and demand of preschool education is balanced. About Universal Pre-K Program provides information about application and eligibility. Finally, About This Site contains data sources and selected articles about the program.
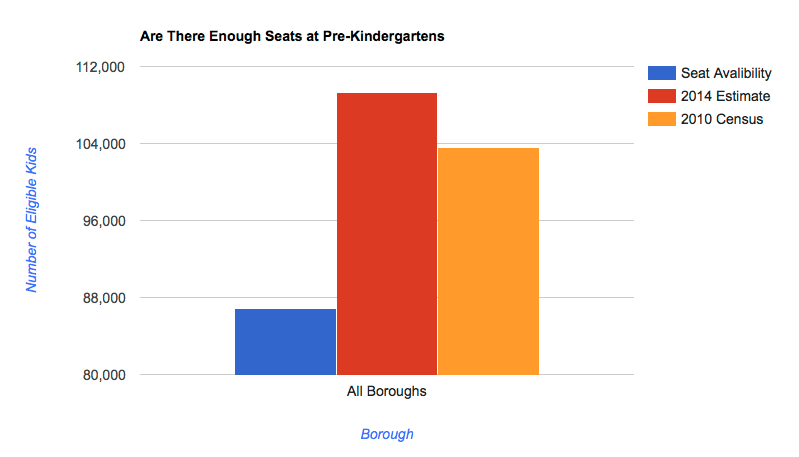
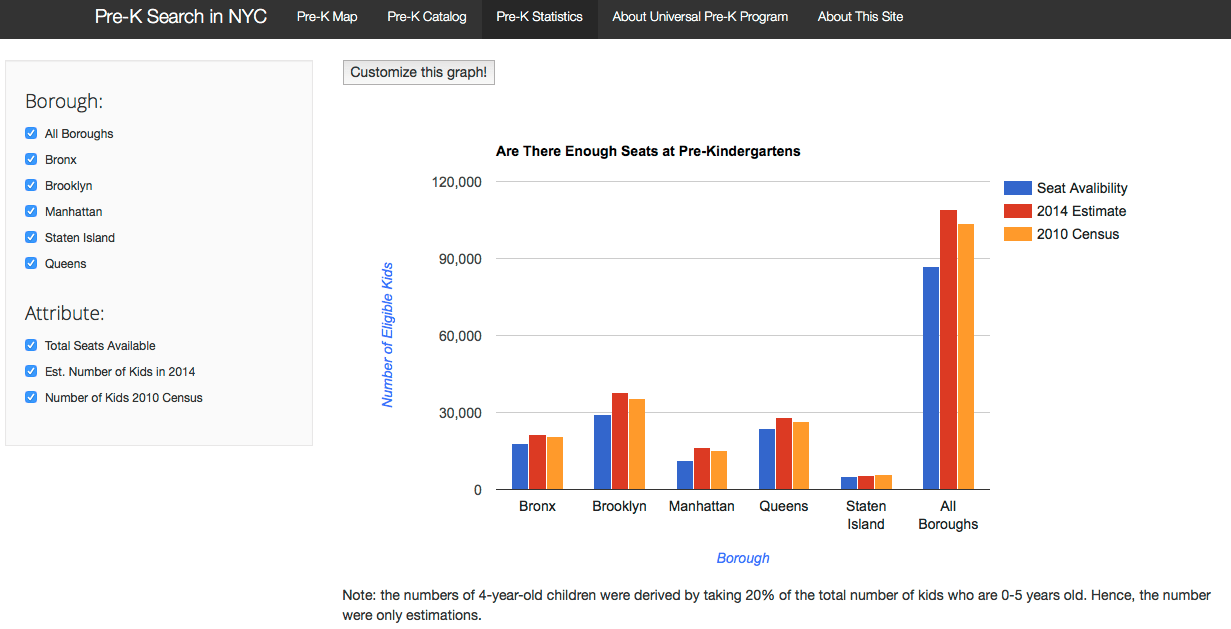
Are There Enough Seats at Pre-K?
Mayor De Blasio promised that every eligible kid in NYC would get a free seat at a local preschool, but is this true? Although city officials insist that a child would never be placed in another borough, CBS New York found at least two cases where that happened. A visualization comparing available seats at preschools and estimated four-year-old kid population shows that preschools in NYC are far from ready to accommodate all eligible children. The orange and red bars show the estimated numbers of four-year-old children based on 2010 Census Report and 2014 Annual Population Estimate respectively. The real population of four-year-old children may be vastly higher than these estimates because the population growth in all NYC boroughs were faster than expected in the past two years.
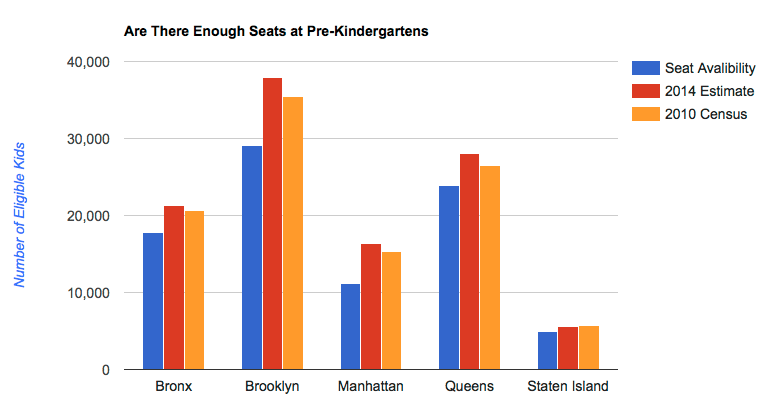
The shortage of seats at preschools sums up to over 20,000 or more in all boroughs.
Technical Details
Data Cleaning
It is important to ensure all pre-K locations have correct geographic information before mapping. I used the function, geocode(), in R package ggmap to convert all addresses into GPS coordinates. To increase accuracy, I pasted zip codes after each address. Unfortunately, while geocode() can convert most addresses correctly, there were incorrect cases. To remedy this problem, I used the latitudes and longitudes of NYC’s geographic boundaries to filter out incorrect locations and reassign them correct geographic coordinates.
################## use address to get long/lat info ################
kinder <- read.csv(url("https://github.com/amy17519/NYCPre-KGuide/blob/master/Universal_Pre-K__UPK__School_Locations.csv"),
                   stringsAsFactors=FALSE)

###### paste zipcodes to all addresses to increase accuracy of locating
kinder$address<- paste(kinder$address,kinder$zip)
geo<-geocode(kinder$address) #use geocode from ggmap package to get longtitude/latitude coordinates
geo<-geo[,c(2,1)]   #change col order of long and lat to match convention

#Find abnormal locations using longitude/latitude boundaries of NYC
#Northernmost pt:40.916541, -73.906637
#Southernmost pt:40.525095, -74.246319
#Easternmost pt:40.722813, -73.688498
#Westernmost pt:40.510940, -74.253454

##### there are 18 suspicious locations that might not be in NYC
index<-which(geo$lat>=40.916541 | geo$lat<= 40.525095 |
             geo$lon>=-73.688498 | geo$lon<= -74.253454)
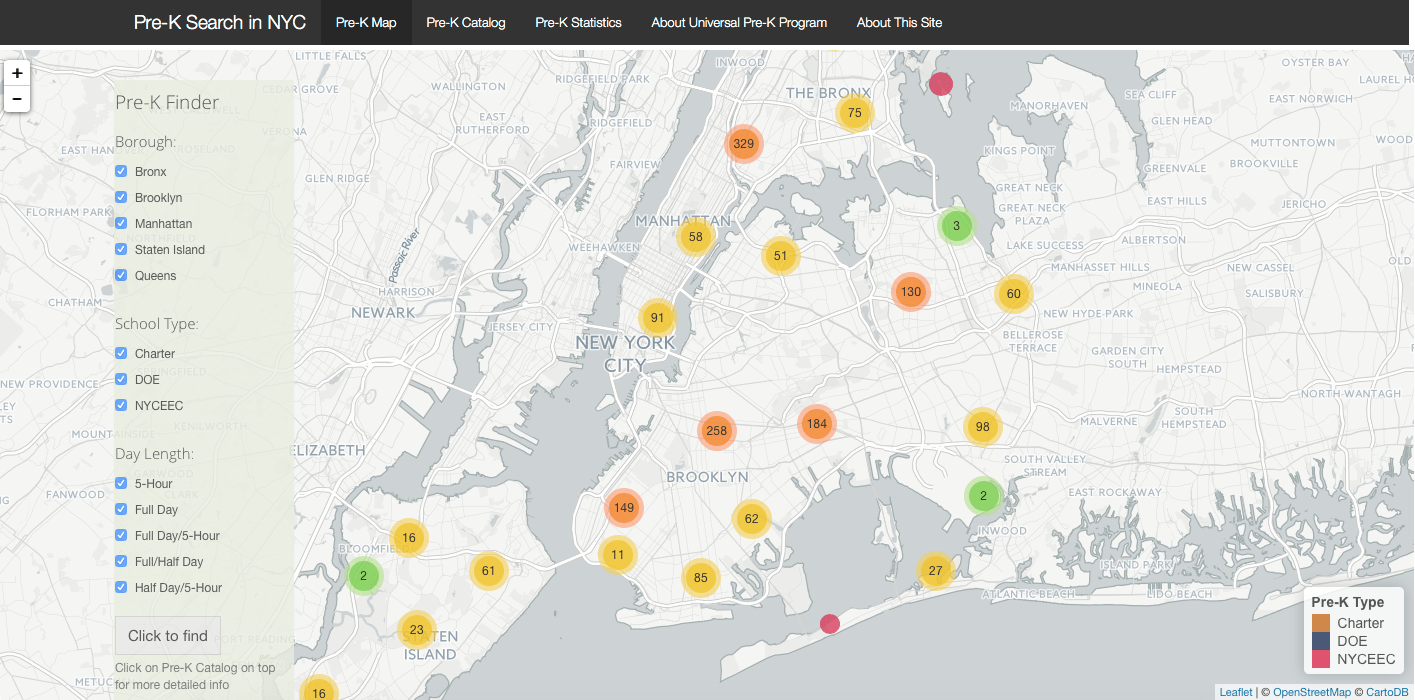
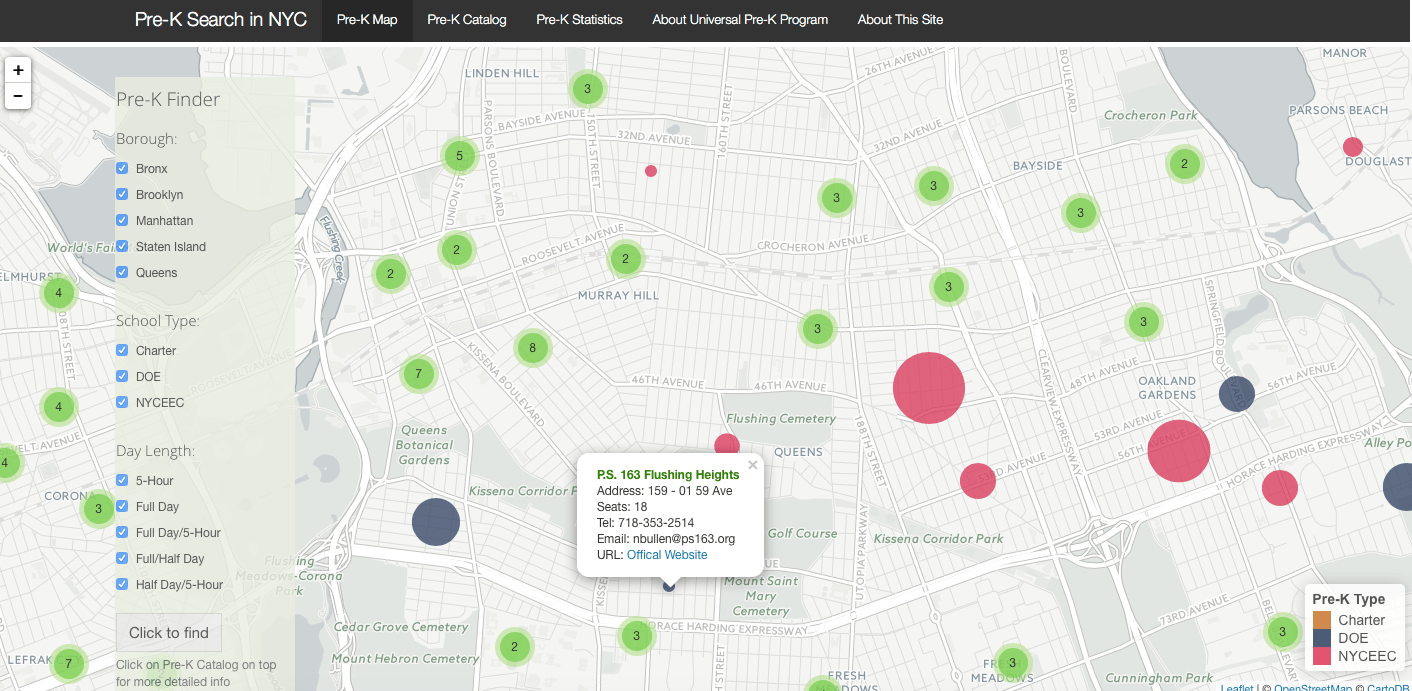
Pre-K Map - Leaflet Map
Having correct geographic coordinates ready, I proceeded to create a leaflet map for pre-K locations. The goal was to create a user-friendly map for parents to smoothly browse preschool locations near home and visualize available seats at each location. I used clusterOptions=markerClusterOptions() to group locations so users can visualize which neighborhoods have a high density of preschools. The radius of each circle is normalized by the seat availability, hence pre-Ks with more seats are marked by larges bubbles and vice versa. Also, the colors of bubbles help visualize school types.
In order to increase efficiency, I used observe() function to draw bubbles/locations whenever the user selects new search criteria. This function prevents Leaflet from having to redraw the entire map, which enhances user experience and webpage efficiency.
Please go to Github repo for code details. This is a screenshot of the resulting map.
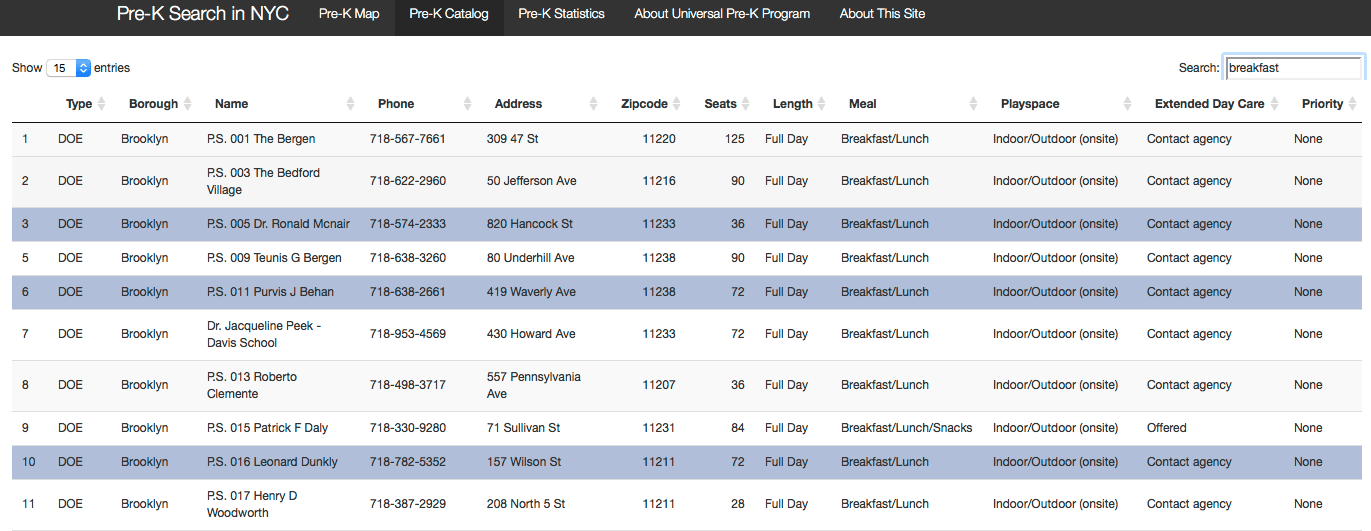
Pre-K Catalog - Data Table
Pre-K Catalog provides a searchable directory for parents to browse available locations. Users can simply search for criteria that are important to them and filter out the most suitable pre-K locations near home. This is how the Pre-K Catalog looks on the Shiny App. Users can also select locations they are interested in for instant comparisons.
Pre-K Statistics - googleVis
I wanted to let users visualize the supply and demand of pre-K seats in each borough as well as the whole of NYC. I used googleVis to create bar plots of kid population and seat availability at preschools. Users can also customize graphs by boroughs and kid population data source. An interesting option under googleVis, gvis.editor, allows users to even customize the vertical bar plots into line charts, horizontal bar plots, and more.
This is how the Pre-K Statistics look on the Shiny App. Users can use both filter panel on the left and the Customize button on top left corner to customize the graph.
R Packages used:
- shiny
- dplyr
- leaflet
- googleVis
Data Source: